Hello fellow Pinch Of KCN blog readers, today we'll be touching on the topic DENSITY. Just to start off, and the Question of the Post today is: have you ever visited or been in/on the Dead Sea? Let's assume you haven't. And you all know that we, the wonderful Pinches of KCN have certainly...not been there. Anyhow, the Dead Sea is obviously not a sea that had been ill. On the contrary,this Dead Sea, located somwhere in Jordan, is a world class phenomenon. And how everything seems to float on the water surface in the Dead Sea appear to be rather unimaginable but yet factual. And the concept behind how even the fattest man on earth will possibly float in the Dead Sea is the idea of DENSITY!!!!
So DENSITY, this word sounds pretty familar...so what exactly is density again?
Density is a property of matter, it is used to measure the heaviness of an object with a constant volume. The closer the particles are together, the denser the object is.
To find Density you must have Mass divided by Volume!!! *D = M/V*
Most common units for Density,
For Solids it should be grams per centimeter cubed (g/cm^3).
For Liquids it should be grams per milliLitre or kilograms per Litre (g/mL, kg/L).
The density of water should be common knowledge:
*1cm^3 water = 1mL of water
*Density of water = 1000 g/L
=1.0 g/mL
If the density of an object is greater than the density of the liquid it is submerged in, it will sink, if the density of an object is lower than the liquid, it will float. This is what people mean by saying "it's so salty you could float a rock in it." Salt makes water denser!And this is how the Dead Sea, aka the Sea of Salt in Hebrew (יָם הַמֶּלַח) seems to "floatify" every object.
Apart from just floating, density also determines the layers in mixtures and suspensions. Denser liquids will sink to the bottom, and lighter liquids float to the top when left still.
An example of the density of aluminum, 135g = 2.7 g/mL
50mL
Since it's getting late already and we all wanted to get a good night sleep, we'll be wrapping up now...
Let us welcome Mr.Lego and his...strange presentation on density.
**Curtain unfolds** "Enjoy the show" - a 60-year-old man's voice pierced through the mist of darkness!
Monday, 31 October 2011
Thursday, 27 October 2011
Measurement and Uncertainty
Every measurement is not exact, they are approximate estimations which we try to get as close as possible to the "exact value".
The two types of uncertainties are "Absolute Uncertainty" and "Relative Uncertainty".
Absolute Uncertainty
Absolute uncertainty is the inaccuracy in a measurement quantity.
Method 1 to express uncertainty:
1. First, collect at least three pieces of data from your measurements
2. Then, we will cancel out unreasonable pieces of data (if present)
3. Add all values together, then divide by the trials number to get an average
4. Subtract the average from the highest and lowest values
5. Record answer
Example:
Lengths of buffalo hair
Trial Length
1 22.3cm
2 10.4cm
3 22.4cm
4 22.1cm (Lowest measurement)
5 22.6cm (Highest measurement)
Since the second trial is clearly erroneous data, we will ignore out this measurement.
Average of lengths: (22.3+22.4+22.1+22.5) ÷ 4 = 22.3cm (Do not forget the UNITS!!!)
Difference between highest measurement: 22.6-22.3 = 0.3cm
Difference between lowest measurement: 22.3-22.1 = 0.2cm
(We use 0.3 as the uncertainty because it is the greater number)
Answer: 22.3 ± 0.3cm is the average length of buffalo hair.
Method 2 to express uncertainty:
We can figure out the uncertainty scale of each measuring tool, and then when we are measuring, we'll make the estimation as precise as possible. This way, we can use the uncertainty scale of the instrument to determine the answer.
Relative Uncertainty
The relative uncertainty is the percentage ratio between the uncertainty of an estimate to the real value of a measurement.
The formula for calculating relative uncertainty is the following:
Absolute uncertainty
estimated measurement
We can express relative uncertainty in two ways:
~ in percentage (%)
~ in significant figures
In percentage
1. First, we use the formula above to calculate an answer
2. Then, we multiply the answer by 100%
Example:Measuring the length of part of a rotten hot dog
The absolute uncertainty is ±0.5cm
The estimated measurement is 10cm
Thus the relative uncertainty is 0.5cm /10cm * 100%=5%
In significant figures
The last digit of a measurement is always uncertain, where the number of sig. figs. represents relative uncertainty.
Want some more practice on this topic?
Download the worksheet made by us! :D
(Topic included: calculating absolute uncertainty, reading measurements, review of sig. figs.)
http://www.mediafire.com/?hrvvwzloc4oyc1d
The link above is not working? Try clicking HERE to download!
And get the answer to the worksheet here:
http://www.mediafire.com/?4fabc5rq07r9i97
The link above is not working? Try clicking HERE to download!
The two types of uncertainties are "Absolute Uncertainty" and "Relative Uncertainty".
Absolute Uncertainty
Absolute uncertainty is the inaccuracy in a measurement quantity.
Method 1 to express uncertainty:
1. First, collect at least three pieces of data from your measurements
2. Then, we will cancel out unreasonable pieces of data (if present)
3. Add all values together, then divide by the trials number to get an average
4. Subtract the average from the highest and lowest values
5. Record answer
Example:
Lengths of buffalo hair
Trial Length
1 22.3cm
3 22.4cm
4 22.1cm (Lowest measurement)
5 22.6cm (Highest measurement)
Since the second trial is clearly erroneous data, we will ignore out this measurement.
Average of lengths: (22.3+22.4+22.1+22.5) ÷ 4 = 22.3cm (Do not forget the UNITS!!!)
Difference between highest measurement: 22.6-22.3 = 0.3cm
Difference between lowest measurement: 22.3-22.1 = 0.2cm
(We use 0.3 as the uncertainty because it is the greater number)
Answer: 22.3 ± 0.3cm is the average length of buffalo hair.
Method 2 to express uncertainty:
We can figure out the uncertainty scale of each measuring tool, and then when we are measuring, we'll make the estimation as precise as possible. This way, we can use the uncertainty scale of the instrument to determine the answer.
Relative Uncertainty
The relative uncertainty is the percentage ratio between the uncertainty of an estimate to the real value of a measurement.
The formula for calculating relative uncertainty is the following:
Absolute uncertainty
estimated measurement
We can express relative uncertainty in two ways:
~ in percentage (%)
~ in significant figures
In percentage
1. First, we use the formula above to calculate an answer
2. Then, we multiply the answer by 100%
Example:Measuring the length of part of a rotten hot dog
The absolute uncertainty is ±0.5cm
The estimated measurement is 10cm
Thus the relative uncertainty is 0.5cm /10cm * 100%=5%
In significant figures
The last digit of a measurement is always uncertain, where the number of sig. figs. represents relative uncertainty.
Want some more practice on this topic?
Download the worksheet made by us! :D
(Topic included: calculating absolute uncertainty, reading measurements, review of sig. figs.)
http://www.mediafire.com/?hrvvwzloc4oyc1d
The link above is not working? Try clicking HERE to download!
And get the answer to the worksheet here:
http://www.mediafire.com/?4fabc5rq07r9i97
The link above is not working? Try clicking HERE to download!
Tuesday, 25 October 2011
Precision and Accuracy, Significant Figures, Rounding Rules
Accuracy vs. Precision
Hi there again. You have probably heard these two words "Accuracy" and "Precision" at least once in your life time. And you have possibly encountered at least 10 people who have been using these two words interchangeably; possibly you're even one of them yourself, which makes it at least 11 people so far. And maybe up until this very moment, you still have completely no idea what I'm trying to point out here. Okay, let me keep this real simple: Accuracy ≠ Precision. So you've been using BAD English all along. (Haha, we're not trying to critize our enthusiastic supporters here, just keep in mind that, we still love you very much, even if you use bad English ,dear!) Now, let us take a deeper look at these two words by CORRECTLY defining them.
Definitions:
Variables used:
factor1: 12.544
factor2: 1.3
sigfig1: 5
sigfig2: 2
SigFigs: 2
product: 16.3072
Printed result: 16
12.544 g= 16.3072g2
16.3072g2 →16g2
Unfortunately Terri's program does not account for non-decimal trailing zeros or units, so she got all of those wrong and naturally failed the course for life.
Hi there again. You have probably heard these two words "Accuracy" and "Precision" at least once in your life time. And you have possibly encountered at least 10 people who have been using these two words interchangeably; possibly you're even one of them yourself, which makes it at least 11 people so far. And maybe up until this very moment, you still have completely no idea what I'm trying to point out here. Okay, let me keep this real simple: Accuracy ≠ Precision. So you've been using BAD English all along. (Haha, we're not trying to critize our enthusiastic supporters here, just keep in mind that, we still love you very much, even if you use bad English ,dear!) Now, let us take a deeper look at these two words by CORRECTLY defining them.
Definitions:
Accuracy is how close the measurement is to true value of the measured quantity.
Precision is how close the measurement is to other ones.
As can be seen in the chart below showing the dart boards of drunk/sober men with good/bad aim, accuracy is being sober, and precision is having a steady hand.
Significant Figures
- more precise digits means there are going to be more significant figures
- the last digit of a value/measurement is usually estimated or uncertain (eg. 2938.234, 4 would be the uncertain number)
- to calculate you must include all of the certain digits and only ONE uncertain digits
- leading zeros are not counted as significant figures(eg. 0.0000001, the number of significant figures is 1)
- trailing zeros without a decimal point do not count. (eg. 10, 1000, 10,000, there is only one significant figure)
- trailing zeros AFTER a decimal point are significant digits. (eg, 32.000 has 5 significant figures)
Rounding Rules
Calculations With Significant Figures
Addition and Subtraction
Problem: Kofia Dicted adds 1.3 grams more sugar in her morning coffee than the average person, which is 12.544 grams. How much sugar does she add in her coffee?
Addition and Subtraction
Problem: Kofia Dicted adds 1.3 grams more sugar in her morning coffee than the average person, which is 12.544 grams. How much sugar does she add in her coffee?
12.544 g
+ 1.3 g
= 13.844 g
As Kofia Dicted is aware of significant figures, she knows that her 1.3 added grams are imprecise, and that the total amount of sugar she adds cannot be more precise than 1.3grams. Thus she rounds off the sum to the first uncertain digit.
13.844g →13.8g
Answer: Kofia Dicted puts approximately 13.8grams of sugar in her coffee.
Multiplication and Division (Programming techniques mentioned are all real)
Problem: Terri Buljo Oaks is making a computer program that multiples with significant figures in mind to avoid actually thinking while doing chemistry homework. The first question is 12.544g x 1.3g
Below is her program's source written in pseudocode.
String.amountOfSigFigs(factor1)=sigfig1;
String.amountOfSigFigs(factor2)=sigfig2; //Finds the number of sig figs each number has
Variable Short Sigfigs=Math.Min(sigfig1,sigfig2); //Finds the lesser number of sig figs
Variable Double Float: product=factor1*factor2; //Finds the product of the two numbers
Print(Math.Round(product,sigfigs)); //Rounds to the number of lesser sig figs and displays the result
Variables used:
factor1: 12.544
factor2: 1.3
sigfig1: 5
sigfig2: 2
SigFigs: 2
product: 16.3072
Printed result: 16
12.544 g
x 1.3 g
3.7632g2
+ 12.544 g2
3.7632g2
+ 12.544 g2
16.3072g2 →16g2
Unfortunately Terri's program does not account for non-decimal trailing zeros or units, so she got all of those wrong and naturally failed the course for life.
Saturday, 15 October 2011
Acids Formation
Naming "non-acids"
Naming ionic "non-acid" names are similar to naming other ionic compounds.
Step 1: First name the positive ion (typically a metal).
Step 2: Now name the negative ion (typically a non-metal).
Step 3: Change the ending of the negative ion to "-ide"
Note that the total charge on a compound must always be zero.
Some examples are: NaCl, K2S; Sodium Chloride, Potassium Sulphide.
Naming simple acids
Simple acids are solutions of hydrogen bonded with non-metals from group 16 and 17 on the Periodic Table.
Step 1: Place the prefix "hydro" at the beginning of the name
Step 2: The name of the non-metal follows and its ending is to be substituted to "ic"
- E.g. S- sulphur will be become sulphuric.
Step 3: Lastly, the word acid is added to the very end.
Some examples of simple acids are listed below,
Formula Non-metal Names Acid Names
HBr hydrogen bromide hydrobromic acid
HI hydrogen iodide hyrdroiodic acid
HF hydrogen fluoride hydrofluoric acid
Naming Complex Acids
Complex acids are defined as solutions of hydrogen bonded with a poly-atomic ion that's negatively charged.
Step 1: The word or prefix of "hydrogen" or "hydro" is taken away in this type of naming.
Step 2: If the negatively charged poly-atomic ion name ends in the following suffix, it must be changed accordingly as shown below,
"-ate" → "-ic" E.g. Chromate →Chromic
"-ite" → "-ous" E.g. Nitrite →Nitrous
Step 3: Now, the word acid is placed at the end.
Some of the examples of complex acids are listed below,
Formula Name Acid Name
H3PO4 phosphoric acid
HNO3 nitric acid
H2SO4 sulphurous acid
Law of Definite Composition (Proust's Law)
- Every chemical compound always contain a fixed proportion of its composite elements by mass
- For instance, CO2(carbon dioxide) has 1 atom of C(carbon) and 2 atoms of O(oxygen). The total mass of CO2 is 44g (C=12g, and 2xO=2x16g=32g) which would apply anywhere in the universe.
- Two or elements can be bonded differently to form multiple compounds where the ratios of the composite masses are different.
- For example, the elements of C(carbon) and O(oxygen) may bond to form CO compound (C:O=3:4) and CO2 compound (C:O=3:8)
Friday, 14 October 2011
Lab 3B: Paper Chromatography
Objective and Conclusion
In Lab 3B, we performed paper chromatography tests with green, a primary colour, and an unknown colour. In this lab, we performed Rf value calculations. Through this process we learned that many components correspond to a certain Rf value. This value is the quotient of the distance from the starting line to the sample spot, and from the starting line to the solvent front, being the dividend and divisor, respectively.
Results From Actual Experiment
On our chromatography paper testing green food colouring, it split into two colours: yellow and blue. This confirms that green is a mixture of the components, yellow and blue. In art, this is well known: that the secondary colour "green" is a combination of the primary colours "yellow" and "blue". Below is a video of a very similar experiment.
Paper Chromatography in the Real World
Apart from purely scientific uses, paper chromatogrphy is used for many applications. This is because it is cheap, relatively quick, and can be used to separate virtually any mixture. Often they are used to test for drugs in one's blood. Even CSI uses it to sequence DNA and RNA.
Thursday, 6 October 2011
Heating and Cooling Curves, Seperation Techniques
Changes in Matter
Heating Curve
A: A solid, closely packed particles in an ordered manner, slow vibrating in fixed positions.
A→B: Gain of heat, KE1 ↑2, temperature ↑.
B: Particles still packed, similar to state A.
B→C: Changes from solid→liquid. Temperature does not change as heat energy is used to overcome the force of attraction (latent heat of fusion). Known as the melting point.
C: Liquid state.
C→D: Temperature ↑ KE ↑
D: Still a liquid, molecules begin to move more freely, starts to become a gas.
D→E: Changes from liquid → gas. Temperature does not change as heat is used to overcome the force of attraction. Known as the boiling point.
E: Gas state
F: As temperature continues to ↑, molecules vibrate faster and KE ↑.
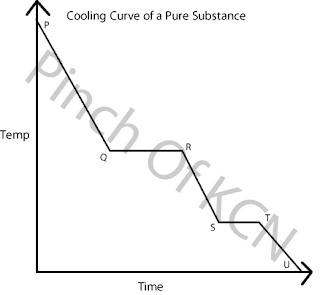
Cooling Curve
P: Gas state. High levels of vibration and KE.
P→Q: Temperature ↓3KE ↓.
Q: Still a gas, molecules begin to form bonds to create liquid.
Q→R: Condensation continues, changes from gas→liquid. Same temperature (latent heat of vaporization).Known as the boiling point.
R: Liquid state
R→S: KE↓ Temperature↓ Molecules lose energy and move closer.
S: Liquid state, beginning to become a solid.
S→T: Changes from liquid→solid. Molecules become ordered into a neat pattern. Known as the freezing point. Temperature remains the same (latent heat of fusion)
T: Solid state.
T→U: Temperature↓
U: Room temperature
Separation Techniques
The basis of separation is founded on different components have different properties, or the magnitude of these properties. Examples of properties include: density, reactivity, volatility, magnetism, solubility, polarity, etc.
Strategies of separation use processes that discriminate between these properties. Strategies include: filtration, flotation, crystallization, extraction, distillation, chromotography, and so on. Below is a chart classifying common methods to separate components.
1: Kinetic Energy
2: Increases
3: Decreases
Heating Curve
A: A solid, closely packed particles in an ordered manner, slow vibrating in fixed positions.
A→B: Gain of heat, KE1 ↑2, temperature ↑.
B: Particles still packed, similar to state A.
B→C: Changes from solid→liquid. Temperature does not change as heat energy is used to overcome the force of attraction (latent heat of fusion). Known as the melting point.
C: Liquid state.
C→D: Temperature ↑ KE ↑
D: Still a liquid, molecules begin to move more freely, starts to become a gas.
D→E: Changes from liquid → gas. Temperature does not change as heat is used to overcome the force of attraction. Known as the boiling point.
E: Gas state
F: As temperature continues to ↑, molecules vibrate faster and KE ↑.
Cooling Curve
P: Gas state. High levels of vibration and KE.
P→Q: Temperature ↓3KE ↓.
Q: Still a gas, molecules begin to form bonds to create liquid.
Q→R: Condensation continues, changes from gas→liquid. Same temperature (latent heat of vaporization).Known as the boiling point.
R: Liquid state
R→S: KE↓ Temperature↓ Molecules lose energy and move closer.
S: Liquid state, beginning to become a solid.
S→T: Changes from liquid→solid. Molecules become ordered into a neat pattern. Known as the freezing point. Temperature remains the same (latent heat of fusion)
T: Solid state.
T→U: Temperature↓
U: Room temperature
Separation Techniques
The basis of separation is founded on different components have different properties, or the magnitude of these properties. Examples of properties include: density, reactivity, volatility, magnetism, solubility, polarity, etc.
Strategies of separation use processes that discriminate between these properties. Strategies include: filtration, flotation, crystallization, extraction, distillation, chromotography, and so on. Below is a chart classifying common methods to separate components.
Type of Matter |
Solid |
Liquid |
Gas |
Solid |
Gravity Separation |
Crystallization |
Adsoprtion |
Liquid |
Filtration |
Chromatography Distillation |
Centrifugation |
Gas |
Absorption |
Demister (tool) |
Adsorption |
1: Kinetic Energy
2: Increases
3: Decreases
Subscribe to:
Posts (Atom)